How Does GABA Shape NMDA Spikes? A Mathematical Analysis Using Bifurcation Theory
My past few blog articles have been heavily focused on the more abstract mathematical aspects of computational neuroscience. Specifically, I have been talking a lot about dynamical systems theory, but today I want to discuss a very practical example of applying this same mathematical theory to a very real example of NMDA spikes and controlling their shape with GABA synapses. A recent paper from the Blue-Brain Project, authored by Michael Doron, Guiseppe Chindemi, Eilif Muller, Henry Markram, Idan Segev, used bifurcation theory to understand how the very precise interplay of GABA, AMPA, and NMDA receptors, control the length of an NMDA spike. All of this theory relies on understanding of saddle-node bifurcations induced by strong and well timed synaptic GABA input.
Lets start with the basics of what is an NMDA spike, and why neuroscientists care about them. NMDA receptors, are excitatory neuroreceptors that are excited by the neurotransmitter glutamate. However, they are highly non-linear and only open when the membrane voltage is highly depolarized. This is because normally the channel pore is blocked by a magnesium ion. However when the voltage is sufficiently depolarized, the magnesium ion pops out. This allows sodium and calcium ions to flow into the neuron creating a stronger depolarization of the membrane. If there are enough NMDA receptors, this can create a positive feedback loop that will create a NMDA spike, which very much can look like a very long (75ms) action potential.
GABA receptors, however, are inhibitory receptors, and repolarize the neuron's membrane. They let chlorine (a negatively charged ion) into the cell, thus lowering the voltage. Thus if enough chlorine enters the cell through GABA receptors then the NMDA spike will be stopped. However, if the influx of chlorine is not strong enough, then the NMDA spike will rebound and not be cut short. Furthermore, the strength of the GABA receptors (or amount of chlorine) necessary to shorten the NMDA spike is dependent on the exact timing of the GABA input. The sooner the GABA input, the stronger the GABA needs to be to terminate the spike. Turns out this is all mediated by a saddle-node bifurcation.
Why do neuroscientists even care how long an NMDA spike lasts? The answers lies in the localized concentration of intracellular calcium ions. Specifically, the longer and NMDA spikes lasts the more calcium ions enter the cell. Recall that neurons tightly regulate the intracellular calcium concentration and have many enzymes that sense the concentration of intracellular calcium. These enzymes, in turn regulate things like synaptic plasticity, genetic expression, dendritic spine growth and a whole host of other functions. These calcium sensing enzymes can be sensitive enough to detect the difference between, low, medium, and high concentrations of calcium. Meaning, that a NMDA spike that was cut short could potentially carry different information than no NMDA spikes, or a full NMDA spike. Even more importantly, these calcium sensing enzymes can measure local calcium concentrations, which is why these NMDA spikes are found in the dendrites in the first place.
While Dr. Doron's team doesn't investigate the effects of cutting the NMDA spike short in this paper, they do mathematically analyze under what conditions is it cut short, and present a quantitative model, and qualitative explanation of how GABA receptors control the NMDA Spikes duration.
To understand how GABA controls the NMDA receptor, first it is important to understand how an NMDA spike works. I've created a model similar to the one used in the paper, modeling the NMDA, AMPA, and GABA receptor inside of a point neuron with similar properties to the ones used in the paper. This model can be described by a one dimensional ordinary differential equation
\begin{equation*}
C_m \frac{dV}{dt}= - g(V-E_{leak})- I_{GABA}(t) -I_{AMPA}(t) -I_{NMDA}(V,t)
\end{equation*}
Notice here that a few things here. First, because the NMDA receptor depends on voltage, this equation is nonlinear, and in fact we can plot this nonlinearity, and geometrically see the equalibria. However, notice that this is a one dimensional ODE, thus we can't plot the nullclines, as when $\frac{dV}{dt}= 0$ is just the equilibrium points. What we can do instead, is plot the steady state current-voltage relation. For any given moment in time, we plot two curves,
\begin{align*}
I_{in}(V)= - I_{AMPA}(t) -I_{NMDA}(V(t),t)\\
I_{out} (V)= - g(V-E_{leak})- I_{GABA}(t)
\end{align*}
Where the outward current $I_{out}$ intersects the inward current $I_{in}$ are also the equilibrium points of the original ODE.
What is a steady state current-voltage relation? We assume that if the synaptic conductance doesn't change in time, what voltage would the steady state relax towards, and what would the balance of outward and inward current be. These are the red, and blue curves. Where these curves intersect are the equilibrium points for the nonlinear system (black dots). Put another way, if the synaptic conductance was held constant, the voltage would relax to the solid black equilbria points. Of course, the synaptic conductance does change in time, as the neurotransmitters breakdown, or are reabsorbed, the strength of the synaptic currents slowly decays. Thus, I've created a GIF showing how these two lines change overtime, and how the actual solution to the ODE changes in time (green dot).
The first thing that will become clear is how close the green solution will follow the closest black equilibrium point be to the equilibrium points, this because this approximation of the system actually does a very good job at describing the dynamics.
Let us first examine a NMDA spike with no GABA input.
The next thing we notice is there is only one equilibrium point and the red line is flat line at $I_{out}=0$. When the synaptic NMDA input begins, the red outward current gets very big, very fast and suddenly that single equilibrium at a very positive voltage, and the black solution dot begins to move towards the equilibrium point, this corresponds to the initial upswing of the NMDA spike, which occurs over a few milliseconds. As time progresses, the red curve gets smaller and smaller and eventually a hump appears, this hump crosses the blue line creating two new equilibria (one solid and one a black circle), making a total of three equilibrium. These two new equilibrium are near the rest equilibrium. The new solid black equilibrium is a second stable equilibrium while the empty black circle is an unstable equilibrium. This sudden appearance (or as we will see later, disappearance) is known as a saddle-node bifurcation. Because there are three equilibria, with the unstable equilibrium in the middle this separates our solution into two areas, one where there is a voltage plateau for the NMDA spiking solution, and the other, the rest equilibrium, where there is no NMDA spike.
As time continues to progress, we notice that the unstable equilibrium and the voltage plateau equilibria start moving closer and closer together until eventually they collide and annihilate each other. This corresponds to the downswing of the NDMA response. The solution no longer has an unstable equilibrium preventing the solution from relaxing to rest. Therefor, with the unstable equilibrium gone the NMDA spike can relax to rest. A keen observer will notice that there was a saddle-node bifurcation the beginning of the NMDA spike is as well. This happens over the course of a few milliseconds and can be hard to catch.
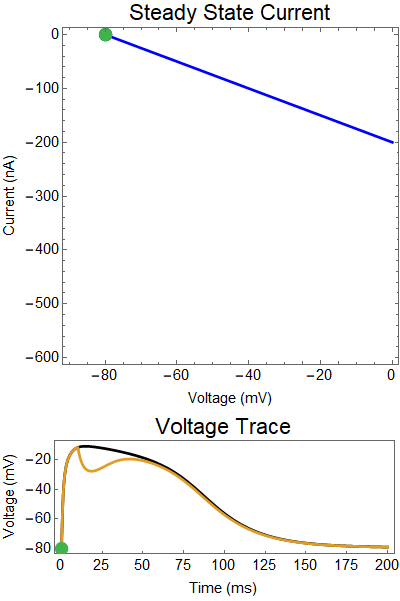
How does GABA play a role here? GABA essentially controls the slope of the Outward steady-state current (blue line). Take a look at the second GIF. When the GABA stimulus occurs you'll notice that the blue line becomes suddenly much steeper. This of course causes the saddle-node bifurcation to occur sooner, thus terminating the NMDA spike. However, there is a caveat. if the GABA input is too soon, or too weak, then the saddle-node bifurcation may not occur. By looking at the third GIF we can see this. The GABA input is 15 ms earlier and while the saddle-node almost occurs, it doesn't quite, and then the GABA input begins to decay, (faster than the NMDA decays) and you'll see that the two equilibria will actually move farther apart. This is the NMDA spike regeneration that Dr. Doron et al. discuss in their paper.
This gives a basic overview of the papers main idea. The main takeaway is early termination of a NMDA spike is mediated by a saddle-node bifurcation. They test this basic theory under a large possible combinations of potential synaptic and morphological conditions. Including where all of these synapses are located in a dendritic tree. However to fully describe any of the different scenarios they present in the paper, it all revolves around determining if the GABA synaptic induces a saddle-node bifurcation. If it does, than the scenario, can prematurely cut a NMDA spike short.
I hope this gives a more concrete example of how dynamical systems theory is important in understanding real biological systems. Toy models are great for understanding the theory, but applying the math to real biological systems is also very important. Dr. Doron and his team, do a great job of using bifurcation theory to understand synaptic dynamics.
Author: Alexander J. White
Source: M. Doron, G. Chindemi, E. Muller, H. Markram, I. Segev. Timed Synaptic Inhibition Shapes NMDA Spikes, Influencing Local Dendritic Processing and Global I/O Properties of Cortical Neurons. Cell Reports. 07 November 2017
Lets start with the basics of what is an NMDA spike, and why neuroscientists care about them. NMDA receptors, are excitatory neuroreceptors that are excited by the neurotransmitter glutamate. However, they are highly non-linear and only open when the membrane voltage is highly depolarized. This is because normally the channel pore is blocked by a magnesium ion. However when the voltage is sufficiently depolarized, the magnesium ion pops out. This allows sodium and calcium ions to flow into the neuron creating a stronger depolarization of the membrane. If there are enough NMDA receptors, this can create a positive feedback loop that will create a NMDA spike, which very much can look like a very long (75ms) action potential.
GABA receptors, however, are inhibitory receptors, and repolarize the neuron's membrane. They let chlorine (a negatively charged ion) into the cell, thus lowering the voltage. Thus if enough chlorine enters the cell through GABA receptors then the NMDA spike will be stopped. However, if the influx of chlorine is not strong enough, then the NMDA spike will rebound and not be cut short. Furthermore, the strength of the GABA receptors (or amount of chlorine) necessary to shorten the NMDA spike is dependent on the exact timing of the GABA input. The sooner the GABA input, the stronger the GABA needs to be to terminate the spike. Turns out this is all mediated by a saddle-node bifurcation.
Why do neuroscientists even care how long an NMDA spike lasts? The answers lies in the localized concentration of intracellular calcium ions. Specifically, the longer and NMDA spikes lasts the more calcium ions enter the cell. Recall that neurons tightly regulate the intracellular calcium concentration and have many enzymes that sense the concentration of intracellular calcium. These enzymes, in turn regulate things like synaptic plasticity, genetic expression, dendritic spine growth and a whole host of other functions. These calcium sensing enzymes can be sensitive enough to detect the difference between, low, medium, and high concentrations of calcium. Meaning, that a NMDA spike that was cut short could potentially carry different information than no NMDA spikes, or a full NMDA spike. Even more importantly, these calcium sensing enzymes can measure local calcium concentrations, which is why these NMDA spikes are found in the dendrites in the first place.
While Dr. Doron's team doesn't investigate the effects of cutting the NMDA spike short in this paper, they do mathematically analyze under what conditions is it cut short, and present a quantitative model, and qualitative explanation of how GABA receptors control the NMDA Spikes duration.
To understand how GABA controls the NMDA receptor, first it is important to understand how an NMDA spike works. I've created a model similar to the one used in the paper, modeling the NMDA, AMPA, and GABA receptor inside of a point neuron with similar properties to the ones used in the paper. This model can be described by a one dimensional ordinary differential equation
\begin{equation*}
C_m \frac{dV}{dt}= - g(V-E_{leak})- I_{GABA}(t) -I_{AMPA}(t) -I_{NMDA}(V,t)
\end{equation*}
Notice here that a few things here. First, because the NMDA receptor depends on voltage, this equation is nonlinear, and in fact we can plot this nonlinearity, and geometrically see the equalibria. However, notice that this is a one dimensional ODE, thus we can't plot the nullclines, as when $\frac{dV}{dt}= 0$ is just the equilibrium points. What we can do instead, is plot the steady state current-voltage relation. For any given moment in time, we plot two curves,
\begin{align*}
I_{in}(V)= - I_{AMPA}(t) -I_{NMDA}(V(t),t)\\
I_{out} (V)= - g(V-E_{leak})- I_{GABA}(t)
\end{align*}
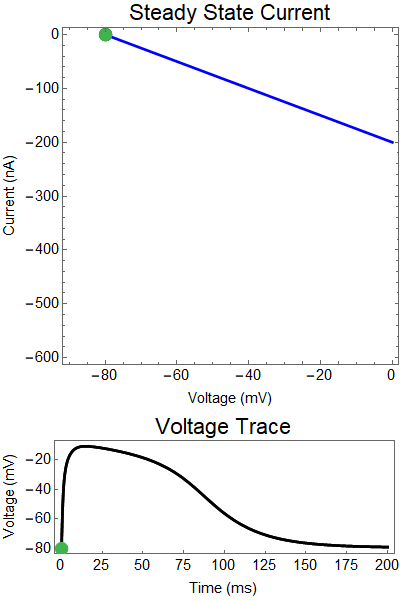 |
| Figure 1: Shows a NMDA spike with no GABA input. First Panel shows the steady-state inward current $I_{in}(t)$ (red), and the steady-state outward current $I_{out}(t)$ blue. The GIF shows the evolution of the steady-state currents during an NMDA spike. The green dot shows the value of the inward current. Black solid dots are equilibria, and black empty circles are unstable equilibria. The Bottom panel shows a NMDA spike, with the green dot showing the voltage at the given time during the GIF. |
Where the outward current $I_{out}$ intersects the inward current $I_{in}$ are also the equilibrium points of the original ODE.
What is a steady state current-voltage relation? We assume that if the synaptic conductance doesn't change in time, what voltage would the steady state relax towards, and what would the balance of outward and inward current be. These are the red, and blue curves. Where these curves intersect are the equilibrium points for the nonlinear system (black dots). Put another way, if the synaptic conductance was held constant, the voltage would relax to the solid black equilbria points. Of course, the synaptic conductance does change in time, as the neurotransmitters breakdown, or are reabsorbed, the strength of the synaptic currents slowly decays. Thus, I've created a GIF showing how these two lines change overtime, and how the actual solution to the ODE changes in time (green dot).
The first thing that will become clear is how close the green solution will follow the closest black equilibrium point be to the equilibrium points, this because this approximation of the system actually does a very good job at describing the dynamics.
Let us first examine a NMDA spike with no GABA input.
The next thing we notice is there is only one equilibrium point and the red line is flat line at $I_{out}=0$. When the synaptic NMDA input begins, the red outward current gets very big, very fast and suddenly that single equilibrium at a very positive voltage, and the black solution dot begins to move towards the equilibrium point, this corresponds to the initial upswing of the NMDA spike, which occurs over a few milliseconds. As time progresses, the red curve gets smaller and smaller and eventually a hump appears, this hump crosses the blue line creating two new equilibria (one solid and one a black circle), making a total of three equilibrium. These two new equilibrium are near the rest equilibrium. The new solid black equilibrium is a second stable equilibrium while the empty black circle is an unstable equilibrium. This sudden appearance (or as we will see later, disappearance) is known as a saddle-node bifurcation. Because there are three equilibria, with the unstable equilibrium in the middle this separates our solution into two areas, one where there is a voltage plateau for the NMDA spiking solution, and the other, the rest equilibrium, where there is no NMDA spike.
As time continues to progress, we notice that the unstable equilibrium and the voltage plateau equilibria start moving closer and closer together until eventually they collide and annihilate each other. This corresponds to the downswing of the NDMA response. The solution no longer has an unstable equilibrium preventing the solution from relaxing to rest. Therefor, with the unstable equilibrium gone the NMDA spike can relax to rest. A keen observer will notice that there was a saddle-node bifurcation the beginning of the NMDA spike is as well. This happens over the course of a few milliseconds and can be hard to catch.
 |
| Figure 2: Shows a NMDA spike with a strong GABA input at 25 ms. First Panel shows the steady-state inward current $I_{in}(t)$ (red), and the steady-state outward current $I_{out}(t)$ blue. The GIF shows the evolution of the steady-state currents during an NMDA spike. The green dot shows the value of the inward current. Black solid dots are equilibria, and black empty circles are unstable equilibria. Notice that there when the blue line becomes steep the saddle-node bifurcation happens early, and never reforms. The Bottom panel shows a NMDA Spike without GABA (black), as well as the NMDA spike cut short by the GABA input (yellow), with the green dot showing the voltage at the given time during the GIF. |
How does GABA play a role here? GABA essentially controls the slope of the Outward steady-state current (blue line). Take a look at the second GIF. When the GABA stimulus occurs you'll notice that the blue line becomes suddenly much steeper. This of course causes the saddle-node bifurcation to occur sooner, thus terminating the NMDA spike. However, there is a caveat. if the GABA input is too soon, or too weak, then the saddle-node bifurcation may not occur. By looking at the third GIF we can see this. The GABA input is 15 ms earlier and while the saddle-node almost occurs, it doesn't quite, and then the GABA input begins to decay, (faster than the NMDA decays) and you'll see that the two equilibria will actually move farther apart. This is the NMDA spike regeneration that Dr. Doron et al. discuss in their paper.
 |
| Figure 3: Shows a NMDA spike with a strong GABA input at 10 ms. Notice the NMDA spike regenerates. First Panel shows the steady-state inward current $I_{in}(t)$ (red), and the steady-state outward current $I_{out}(t)$ blue. The GIF shows the evolution of the steady-state currents during an NMDA spike. The green dot shows the value of the inward current. Black solid dots are equilibria, and black empty circles are unstable equilibria. Notice that there when the blue line becomes steep the saddle-node bifurcation happens early, andpike cut short never reforms. The Bottom panel shows a NMDA Spike without GABA (black), as well as the NMDA regeneration in spite of the GABA input (yellow), with the green dot showing the voltage at the given time during the GIF. |
This gives a basic overview of the papers main idea. The main takeaway is early termination of a NMDA spike is mediated by a saddle-node bifurcation. They test this basic theory under a large possible combinations of potential synaptic and morphological conditions. Including where all of these synapses are located in a dendritic tree. However to fully describe any of the different scenarios they present in the paper, it all revolves around determining if the GABA synaptic induces a saddle-node bifurcation. If it does, than the scenario, can prematurely cut a NMDA spike short.
I hope this gives a more concrete example of how dynamical systems theory is important in understanding real biological systems. Toy models are great for understanding the theory, but applying the math to real biological systems is also very important. Dr. Doron and his team, do a great job of using bifurcation theory to understand synaptic dynamics.
Author: Alexander J. White
Source: M. Doron, G. Chindemi, E. Muller, H. Markram, I. Segev. Timed Synaptic Inhibition Shapes NMDA Spikes, Influencing Local Dendritic Processing and Global I/O Properties of Cortical Neurons. Cell Reports. 07 November 2017


留言
張貼留言